Thursday, July 7, 2011

43. Population Profile


The definition of a population profile is a chart showing the number of people as a function of their ages.  This one shows the population in illions of less developed countries in 2000.   

42. Scatterplot


A scatterplot is a type of diagram which uses coordinates to display the values of a set of data from two variables, which are represented on the horizontal and verticles axis.  The scatterplot presented here displays data from 113 countries showing the viewer how rich various countries are versus how much their wealth is shared, focusing on the U.S.

Tuesday, July 5, 2011

41. Index Value Plot


An index value plot depicts relativity of values from an indexed value onto a line graph.  This is an S&P 500 stock index showing the value that it has kept throughout the year. 

40. Accumulative Line Graph


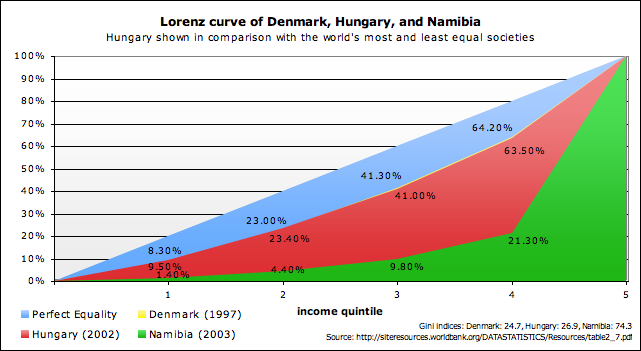
An accumulative line graph, or Lorenz curve, shows the proportionality of distribution, representing the probability of distribution and commonly used in analysis of inequality and economics.  It usually presents income distribution, using percentages of incomes and households.  This curve shows the income proportionality comparing three different countries of varying development: Denmark, Hungary, and Namibia.    

39. Bilateral Graph


A bilateral graph depicts positive and negative values onto a single graph, often displayed as a bar graph, up and down from a zero line, but may also be displayed other ways.  This bilateral graph shows annual revenues from various nations around the world in U.S. dollars (millions). 

Friday, July 1, 2011

38. Nominal Area Choropleth Map


Nominal area choropleth maps present nominal details without necessarily having an order, usually with colors describing the quantitative data.  This is a map which presents data of worldwide nominal GDP per capita.

37. Unstandardized Choropleth Map


Unstandardized choropleths maps reveal raw data and real numbers rather than percentages or some other form of standardization.  This map has colors which represent the amount of orchard acres  across the U.S. 

Followers